尽管像 Python 和 R 这样的语言在数据科学领域越来越受欢迎,但 C 和 C++ 也可以是高效且有效的数据科学的强大选择。在本文中,我们将使用 C99 和 C++11 编写一个程序,该程序使用 Anscombe 四重奏数据集,我将在接下来对此进行解释。
我在一篇关于 Python 和 GNU Octave 的文章中写了关于我不断学习语言的动机,这篇文章值得回顾。所有程序都旨在在 命令行中运行,而不是通过 图形用户界面 (GUI) 运行。完整的示例可在 polyglot_fit 存储库中找到。
编程任务
您将在本系列中编写的程序
- 从 CSV 文件读取数据
- 用直线插值数据(即 f(x)=m ⋅ x + q)
- 将结果绘制到图像文件
这是许多数据科学家都遇到过的常见情况。示例数据是 Anscombe 四重奏的第一组,如下表所示。这是一组人工构造的数据,当用直线拟合时会给出相同的结果,但它们的图却大相径庭。数据文件是一个文本文件,其中制表符作为列分隔符,几行作为标题。此任务将仅使用第一组(即前两列)。
| I | II | III | IV | ||||
|---|---|---|---|---|---|---|---|
| x | y | x | y | x | y | x | y |
| 10.0 | 8.04 | 10.0 | 9.14 | 10.0 | 7.46 | 8.0 | 6.58 |
| 8.0 | 6.95 | 8.0 | 8.14 | 8.0 | 6.77 | 8.0 | 5.76 |
| 13.0 | 7.58 | 13.0 | 8.74 | 13.0 | 12.74 | 8.0 | 7.71 |
| 9.0 | 8.81 | 9.0 | 8.77 | 9.0 | 7.11 | 8.0 | 8.84 |
| 11.0 | 8.33 | 11.0 | 9.26 | 11.0 | 7.81 | 8.0 | 8.47 |
| 14.0 | 9.96 | 14.0 | 8.10 | 14.0 | 8.84 | 8.0 | 7.04 |
| 6.0 | 7.24 | 6.0 | 6.13 | 6.0 | 6.08 | 8.0 | 5.25 |
| 4.0 | 4.26 | 4.0 | 3.10 | 4.0 | 5.39 | 19.0 | 12.50 |
| 12.0 | 10.84 | 12.0 | 9.13 | 12.0 | 8.15 | 8.0 | 5.56 |
| 7.0 | 4.82 | 7.0 | 7.26 | 7.0 | 6.42 | 8.0 | 7.91 |
| 5.0 | 5.68 | 5.0 | 4.74 | 5.0 | 5.73 | 8.0 | 6.89 |
C 的方法
C 是一种通用的编程语言,是当今使用最流行的语言之一(根据来自 TIOBE 指数、RedMonk 编程语言排名、编程语言流行度指数和 GitHub Octoverse 状态的数据)。它是一种相当古老的语言(大约 1973 年),许多成功的程序都是用它编写的(例如,Linux 内核和 Git 仅举两个例子)。它也是最接近计算机内部运作的语言之一,因为它用于直接操作内存。它是一种 编译型语言;因此,源代码必须由 编译器翻译成 机器代码。它的 标准库很小且功能较少,因此开发了其他库来提供缺失的功能。
它是我最常用于 数值计算的语言,主要是因为它的性能。我发现使用它相当乏味,因为它需要大量的 样板代码,但它在各种环境中都得到很好的支持。C99 标准是最近的一个修订版,它添加了一些巧妙的功能,并受到编译器的良好支持。
我将在过程中介绍 C 和 C++ 编程的必要背景知识,以便初学者和高级用户都能跟上。
安装
要使用 C99 进行开发,您需要一个编译器。我通常使用 Clang,但 GCC 是另一个有效的开源编译器。对于线性拟合,我选择使用 GNU 科学库。对于绘图,我找不到任何合理的库,因此该程序依赖于一个外部程序:Gnuplot。该示例还使用动态数据结构来存储数据,该数据结构在 伯克利软件发行版 (BSD) 中定义。
在 Fedora 中安装就像运行一样简单
sudo dnf install clang gnuplot gsl gsl-devel代码注释
在 C99 中,注释的格式是在行首放置 //,该行其余部分将被解释器丢弃。或者,/* 和 */ 之间的任何内容也会被丢弃。
// This is a comment ignored by the interpreter.
/* Also this is ignored */
必要的库
库由两部分组成
- 包含函数描述的 头文件
- 包含函数定义的源文件
头文件包含在源文件中,而库的源文件 链接到可执行文件。因此,此示例所需的头文件是
// Input/Output utilities
#include <stdio.h>
// The standard library
#include <stdlib.h>
// String manipulation utilities
#include <string.h>
// BSD queue
#include <sys/queue.h>
// GSL scientific utilities
#include <gsl/gsl_fit.h>
#include <gsl/gsl_statistics_double.h>
主函数
在 C 中,程序必须位于名为 main(): 的特殊函数内:
int main(void) {
    ...
}
这与 Python 不同,正如上一个教程中所述,Python 将运行在源文件中找到的任何代码。
定义变量
在 C 中,变量必须在使用前声明,并且必须与类型关联。每当您想使用变量时,都必须决定在其中存储哪种类型的数据。您还可以指定是否打算将变量用作常量值,这不是必需的,但编译器可以从此信息中受益。来自存储库中的 fitting_C99.c 程序
const char *input_file_name = "anscombe.csv";
const char *delimiter = "\t";
const unsigned int skip_header = 3;
const unsigned int column_x = 0;
const unsigned int column_y = 1;
const char *output_file_name = "fit_C99.csv";
const unsigned int N = 100;
C 中的数组不是动态的,因为它们的长度必须提前确定(即在编译之前)
int data_array[1024];由于您通常不知道文件中有多少数据点,请使用 单链表。这是一种可以无限增长的动态数据结构。幸运的是,BSD 提供了链表。这是一个示例定义
struct data_point {
    double x;
    double y;

    SLIST_ENTRY(data_point) entries;
};

SLIST_HEAD(data_list, data_point) head = SLIST_HEAD_INITIALIZER(head);
SLIST_INIT(&head);
此示例定义了一个 data_point 列表,该列表由结构化值组成,这些值同时包含 x 值和 y 值。语法相当复杂但直观,详细描述它会过于冗长。
打印输出
要在终端上打印,您可以使用 printf() 函数,它的工作方式类似于 Octave 的 printf() 函数(在第一篇文章中描述)
printf("#### Anscombe's first set with C99 ####\n");printf() 函数不会自动在打印字符串的末尾添加换行符,因此您必须添加它。第一个参数是一个字符串,它可以包含要传递给函数的其他参数的格式信息,例如
printf("Slope: %f\n", slope);读取数据
现在到了困难的部分……C 中有一些用于 CSV 文件解析的库,但似乎没有一个足够稳定或流行到可以放在 Fedora 软件包存储库中。为了避免为此教程添加依赖项,我决定自己编写这部分。同样,深入细节会过于冗长,所以我只会解释总体思路。为了简洁起见,源文件中的某些行将被忽略,但您可以在存储库中找到完整的示例。
首先,打开输入文件
FILE* input_file = fopen(input_file_name, "r");然后逐行读取文件,直到出现错误或文件结束
while (!ferror(input_file) && !feof(input_file)) {
    size_t buffer_size = 0;
    char *buffer = NULL;

    getline(&buffer, &buffer_size, input_file);

    ...
}
getline() 函数是 POSIX.1-2008 标准中最近添加的一个不错的函数。它可以读取文件中的整行并负责分配必要的内存。然后使用 strtok() 函数将每行拆分为 标记。循环遍历标记,选择您想要的列
char *token = strtok(buffer, delimiter);

while (token != NULL)
{
    double value;
    sscanf(token, "%lf", &value);

    if (column == column_x) {
        x = value;
    } else if (column == column_y) {
        y = value;
    }

    column += 1;
    token = strtok(NULL, delimiter);
}
最后,当选择了 x 和 y 值时,将新的数据点插入链表
struct data_point *datum = malloc(sizeof(struct data_point));
datum->x = x;
datum->y = y;

SLIST_INSERT_HEAD(&head, datum, entries);
malloc() 函数为新的数据点动态分配(保留)一些持久内存。
拟合数据
GSL 线性拟合函数 gsl_fit_linear() 期望其输入为简单数组。因此,由于您无法预先知道您创建的数组的大小,因此您必须手动分配它们的内存
const size_t entries_number = row - skip_header - 1;

double *x = malloc(sizeof(double) * entries_number);
double *y = malloc(sizeof(double) * entries_number);
然后,循环遍历链表以将相关数据保存到数组中
SLIST_FOREACH(datum, &head, entries) {
    const double current_x = datum->x;
    const double current_y = datum->y;

    x[i] = current_x;
    y[i] = current_y;

    i += 1;
}现在您已经完成了链表,清理它。始终释放手动分配的内存,以防止 内存泄漏。内存泄漏非常糟糕。每次内存未释放时,花园侏儒都会失去头部
while (!SLIST_EMPTY(&head)) {
    struct data_point *datum = SLIST_FIRST(&head);

    SLIST_REMOVE_HEAD(&head, entries);

    free(datum);
}
最后,终于(!),您可以拟合您的数据了
gsl_fit_linear(x, 1, y, 1, entries_number,
               &intercept, &slope,
               &cov00, &cov01, &cov11, &chi_squared);
const double r_value = gsl_stats_correlation(x, 1, y, 1, entries_number);

printf("Slope: %f\n", slope);
printf("Intercept: %f\n", intercept);
printf("Correlation coefficient: %f\n", r_value);
绘图
您必须使用外部程序进行绘图。因此,将拟合函数保存到外部文件
const double step_x = ((max_x + 1) - (min_x - 1)) / N;

for (unsigned int i = 0; i < N; i += 1) {
    const double current_x = (min_x - 1) + step_x * i;
    const double current_y = intercept + slope * current_x;

    fprintf(output_file, "%f\t%f\n", current_x, current_y);
}
用于绘制两个文件的 Gnuplot 命令是
plot 'fit_C99.csv' using 1:2 with lines title 'Fit', 'anscombe.csv' using 1:2 with points pointtype 7 title 'Data'结果
在运行程序之前,您必须编译它
clang -std=c99 -I/usr/include/ fitting_C99.c -L/usr/lib/ -L/usr/lib64/ -lgsl -lgslcblas -o fitting_C99此命令告诉编译器使用 C99 标准,读取 fitting_C99.c 文件,加载库 gsl 和 gslcblas,并将结果保存到 fitting_C99。命令行上的结果输出是
#### Anscombe's first set with C99 ####
Slope: 0.500091
Intercept: 3.000091
Correlation coefficient: 0.816421
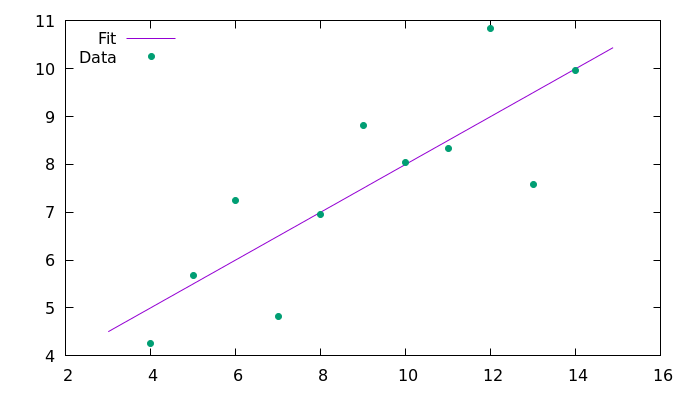
这是使用 Gnuplot 生成的结果图像。

C++11 的方法
C++ 是一种通用的编程语言,也是当今使用最流行的语言之一。它是在 1983 年作为 C 的后继者创建的,重点是 面向对象编程 (OOP)。C++ 通常被认为是 C 的超集,因此 C 程序应该能够使用 C++ 编译器编译。这并不完全正确,因为在某些极端情况下它们的行为会有所不同。以我的经验来看,C++ 比 C 需要更少的样板代码,但如果您想开发对象,语法会更困难。C++11 标准是最近的一个修订版,它添加了一些巧妙的功能,并且或多或少受到编译器的支持。
由于 C++ 在很大程度上与 C 兼容,我将仅强调两者之间的差异。如果我没有在本部分中介绍某个部分,则意味着它与 C 中的相同。
安装
C++ 示例的依赖项与 C 示例相同。在 Fedora 上,运行
sudo dnf install clang gnuplot gsl gsl-devel必要的库
库的工作方式与 C 中相同,但 include 指令略有不同
#include <cstdlib>
#include <cstring>
#include <iostream>
#include <fstream>
#include <string>
#include <vector>
#include <algorithm>

extern "C" {
#include <gsl/gsl_fit.h>
#include <gsl/gsl_statistics_double.h>
}
由于 GSL 库是用 C 编写的,因此您必须将此特性告知编译器。
定义变量
C++ 比 C 支持更多的数据类型(类),例如 string 类型,它比 C 中的对应类型具有更多功能。相应地更新变量的定义
const std::string input_file_name("anscombe.csv");对于像字符串这样的结构化对象,您可以定义变量而无需使用 = 符号。
打印输出
您可以使用 printf() 函数,但 cout 对象更符合习惯用法。使用运算符 << 指示要使用 cout 打印的字符串(或对象)
std::cout << "#### Anscombe's first set with C++11 ####" << std::endl;

...

std::cout << "Slope: " << slope << std::endl;
std::cout << "Intercept: " << intercept << std::endl;
std::cout << "Correlation coefficient: " << r_value << std::endl;
读取数据
方案与之前相同。文件被打开并逐行读取,但语法不同
std::ifstream input_file(input_file_name);

while (input_file.good()) {
    std::string line;

    getline(input_file, line);

    ...
}
行标记使用与 C99 示例中相同的函数提取。不要使用标准 C 数组,而是使用两个 向量。向量是 C++ 标准库中 C 数组的扩展,允许动态管理内存,而无需显式调用 malloc()
std::vector<double> x;
std::vector<double> y;

// Adding an element to x and y:
x.emplace_back(value);
y.emplace_back(value);
拟合数据
对于 C++ 中的拟合,您不必循环遍历列表,因为向量保证具有连续的内存。您可以直接将指向向量缓冲区的指针传递给拟合函数
gsl_fit_linear(x.data(), 1, y.data(), 1, entries_number,
               &intercept, &slope,
               &cov00, &cov01, &cov11, &chi_squared);
const double r_value = gsl_stats_correlation(x.data(), 1, y.data(), 1, entries_number);

std::cout << "Slope: " << slope << std::endl;
std::cout << "Intercept: " << intercept << std::endl;
std::cout << "Correlation coefficient: " << r_value << std::endl;
绘图
绘图使用与之前相同的方法完成。写入文件
const double step_x = ((max_x + 1) - (min_x - 1)) / N;

for (unsigned int i = 0; i < N; i += 1) {
    const double current_x = (min_x - 1) + step_x * i;
    const double current_y = intercept + slope * current_x;

    output_file << current_x << "\t" << current_y << std::endl;
}

output_file.close();
然后使用 Gnuplot 进行绘图。
结果
在运行程序之前,必须使用类似的命令进行编译
clang++ -std=c++11 -I/usr/include/ fitting_Cpp11.cpp -L/usr/lib/ -L/usr/lib64/ -lgsl -lgslcblas -o fitting_Cpp11命令行上的结果输出是
#### Anscombe's first set with C++11 ####
Slope: 0.500091
Intercept: 3.00009
Correlation coefficient: 0.816421
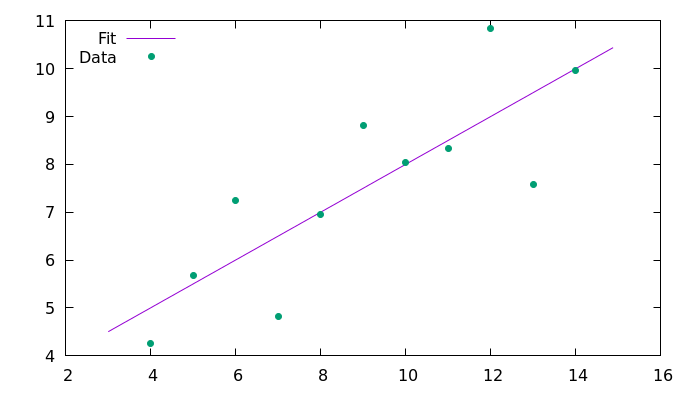
这是使用 Gnuplot 生成的结果图像。

结论
本文提供了 C99 和 C++11 中数据拟合和绘图任务的示例。由于 C++ 在很大程度上与 C 兼容,因此本文利用了它们的相似之处来编写第二个示例。在某些方面,C++ 更易于使用,因为它部分减轻了显式管理内存的负担。但是,语法更复杂,因为它引入了为 OOP 编写类的可能性。但是,仍然可以使用 OOP 方法在 C 中编写软件。由于 OOP 是一种编程风格,因此可以在任何语言中使用。C 中有一些很棒的 OOP 示例,例如 GObject 和 Jansson 库。
对于数值计算,我更喜欢使用 C99,因为它语法更简单且支持广泛。直到最近,C++11 还没有得到广泛支持,我倾向于避免早期版本中的粗糙边缘。对于更复杂的软件,C++ 可能是一个不错的选择。
您也使用 C 或 C++ 进行数据科学吗?在评论中分享您的经验。


14 条评论