

Prometheus 是一个开源的监控和警报系统,通过将定义的指标存储在时间序列数据库中,提供对计算机、应用程序或集群的状态和历史的洞察。它提供了一个强大的查询语言 PromQL,帮助你探索和理解它存储的数据。Prometheus 还包括一个 Alertmanager,可以让你在收集的指标超过某些阈值时轻松触发通知。最重要的是,Prometheus 灵活且易于设置,可以监控你需要跟踪的任何系统的各种指标。
作为 Red Hat OpenShift Dedicated 团队的站点可靠性工程师 (SRE),我们将 Prometheus 用作我们集群和基础设施其他方面的监控和警报的核心组件。使用 Prometheus,我们可以通过跟踪从集群和我们运行的节点收集的数据中的趋势来预测何时可能发生问题。我们可以在超过某些阈值或发生事件时触发警报。作为 Grafana 的数据源,Prometheus 使我们能够生成随时间推移的数据图表,以了解集群或服务的行为方式。
Prometheus 是我们在工作中使用的战略性基础设施,但它对我在家里也很有用。幸运的是,它不仅功能强大且有用,而且易于在家庭环境中设置,无论是否使用 Kubernetes、OpenShift、容器等。本文向你展示如何构建 Prometheus 容器镜像,并设置 Prometheus Node Exporter 以从家用计算机收集数据。它还解释了一些基本的 PromQL,Prometheus 使用的查询语言,用于返回数据和创建图表。
构建 Prometheus 容器镜像
Prometheus 项目发布了自己的容器镜像,quay.io/prometheus/prometheus。但是,我喜欢为家庭项目构建自己的容器镜像,并且更喜欢为我的项目使用 Red Hat 通用基础镜像 系列。 这些镜像可供任何人免费使用。我更喜欢基于 Red Hat Enterprise Linux 8 的 通用基础镜像 8 最小版 (ubi8-minimal) 镜像。 ubi8-minimal 镜像是普通 ubi8 镜像的较小版本。 它比官方 Prometheus 容器镜像的超稀疏 Busybox 镜像更大,但由于我对其他项目使用通用基础镜像,因此该层在磁盘空间方面对我来说是抵消的。(如果两个镜像使用同一层,则该层在它们之间共享,并且在第一个镜像之后不会使用任何额外的磁盘空间。)
我这个项目的 Containerfile 被分割成一个 多阶段构建。 第一阶段,builder,通过 DNF 包安装一些工具,以便更容易地从 GitHub 下载和提取 Prometheus 版本,然后下载我需要的任何架构的特定版本(ARM64 用于我的 Raspberry Pi Kubernetes 集群 或 AMD64 用于在我的笔记本电脑上本地运行),并提取它
# The first stage build, downloading Prometheus from Github and extracting it

FROM registry.access.redhat.com/ubi8/ubi-minimal as builder
LABEL maintainer "Chris Collins <collins.christopher@gmail.com>"

# Install packages needed to download and extract the Prometheus release
RUN microdnf install -y gzip jq tar

# Replace the ARCH for different architecture versions, eg: "linux-arm64.tar.tz"
ENV PROMETHEUS_ARCH="linux-amd64.tar.gz"

# Replace "tag/<tag_name>" with "latest" to build whatever the latest tag is at the time
ENV PROMETHEUS_VERSION="tags/v2.27.0"
ENV PROMETHEUS="https://api.github.com/repos/prometheus/prometheus/releases/${PROMETHEUS_VERSION}"

# The checksum file for the Prometheus project is "sha256sums.txt"
ENV SUMFILE="sha256sums.txt"

RUN mkdir /prometheus
WORKDIR /prometheus

# Download the checksum
RUN /bin/sh -c "curl -sSLf $(curl -sSLf ${PROMETHEUS} -o - | jq -r '.assets[] | select(.name|test(env.SUMFILE)) | .browser_download_url') -o ${SUMFILE}"

# Download the binary tarball
RUN /bin/sh -c "curl -sSLf -O $(curl -sSLf ${PROMETHEUS} -o - | jq -r '.assets[] | select(.name|test(env.PROMETHEUS_ARCH)) |.browser_download_url')"

# Check the binary and checksum match
RUN sha256sum --check --ignore-missing ${SUMFILE}

# Extract the tarball
RUN tar --extract --gunzip --no-same-owner --strip-components=1 --directory /prometheus --file *.tar.gz
多阶段构建的第二阶段将提取的 Prometheus 文件复制到一个原始的 ubi8-minimal 镜像中(不需要第一个镜像中的额外工具来占用最终镜像中的空间),并将二进制文件链接到 $PATH
# The second build stage, creating the final image
FROM registry.access.redhat.com/ubi8/ubi-minimal
LABEL maintainer "Chris Collins <collins.christopher@gmail.com>"

# Get the binary from the builder image
COPY --from=builder /prometheus /prometheus

WORKDIR /prometheus

# Link the binary files into the $PATH
RUN ln prometheus /bin/
RUN ln promtool /bin/

# Validate prometheus binary
RUN prometheus --version

# Add dynamic target (file_sd_config) support to the prometheus config
# https://prometheus.ac.cn/docs/prometheus/latest/configuration/configuration/#file_sd_config
RUN echo -e "\n\
  - job_name: 'dynamic'\n\
    file_sd_configs:\n\
    - files:\n\
      - data/sd_config*.yaml\n\
      - data/sd_config*.json\n\
      refresh_interval: 30s\
" >> prometheus.yml

EXPOSE 9090
VOLUME ["/prometheus/data"]

ENTRYPOINT ["prometheus"]
CMD ["--config.file=prometheus.yml"]
构建镜像
# Build the Prometheus image from the Containerfile
podman build --format docker -f Containerfile -t prometheus
我在家中使用 Podman 作为我的容器引擎,但如果你喜欢,你可以使用 Docker。只需将上面的 podman 命令替换为 docker 即可。
构建此镜像后,你就可以在本地运行 Prometheus 并开始收集一些指标了。
运行 Prometheus
# This only needs to be done once
# This directory will store the metrics Prometheus collects so they persist between container restarts
mkdir data

# Run Prometheus locally, using the ./data directory for persistent data storage
# Note that the image name, prometheus:latest, will be whatever image you are using
podman run --mount=type=bind,src=$(pwd)/data,dst=/prometheus/data,relabel=shared --publish=127.0.0.1:9090:9090 --detach prometheus:latest
上面的 Podman 命令在容器中运行 Prometheus,将 Data 目录挂载到容器中,并允许你仅从运行容器的机器上的浏览器访问 Prometheus Web 界面。 如果你想从其他主机访问 Prometheus,请将命令中的 --publish=127.0.0.1:9090:9090 替换为 --publish=9090:9090。
容器运行后,你应该能够通过 http://127.0.0.1:9000/graph 访问 Prometheus。 然而,目前没有什么可看的。 默认情况下,Prometheus 只知道检查自身(Prometheus 服务)以获取与其自身相关的指标。 例如,导航到上面的链接并输入 prometheus_http_requests_total 的查询将显示 Prometheus 收到了多少 HTTP 请求(很可能只是你到目前为止发出的那些)。

(Chris Collins, CC BY-SA 4.0)
此查询也可以作为 URL 引用
http://127.0.0.1:9090/graph?g0.expr=prometheus_http_requests_total&g0.tab=1&g0.stacked=0&g0.range_input=1h点击它应该会带你到相同的结果。 默认情况下,Prometheus 每 15 秒抓取一次指标,因此这些指标会随着时间的推移而更新(假设自上次抓取以来它们已更改)。
你还可以通过输入查询(如上所述)并单击 Graph 选项卡来绘制数据随时间的推移的图表。

(Chris Collins, CC BY-SA 4.0)
图表也可以作为 URL 引用
http://127.0.0.1:9090/graph?g0.expr=prometheus_http_requests_total&g0.tab=0&g0.stacked=0&g0.range_input=1h但这些内部数据本身并没有什么用。 让我们添加一些有用的指标。
添加一些数据
Prometheus——该项目——发布了一个名为 Node Exporter 的程序,用于导出有关其运行的计算机或节点的有用指标。 你可以使用 Node Exporter 快速为你本地计算机创建一个指标目标,导出诸如内存利用率和 CPU 消耗之类的数据,以供 Prometheus 跟踪。
为了简洁起见,只需运行 Projetheus 项目发布的 quay.io/prometheus/node-exporter:latest 容器镜像即可开始。
使用 Podman 或你选择的容器引擎运行以下命令
podman run --net="host" --pid="host" --mount=type=bind,src=/,dst=/host,ro=true,bind-propagation=rslave --detach quay.io/prometheus/node-exporter:latest --path.rootfs=/host这将在你的本地计算机上启动 Node Exporter,并开始在端口 9100 上发布指标。 你可以通过在浏览器中打开 http://127.0.0.1:9100/metrics 来查看正在生成哪些指标。 它看起来会像这样
# HELP go_gc_duration_seconds A summary of the pause duration of garbage collection cycles.
# TYPE go_gc_duration_seconds summary
go_gc_duration_seconds{quantile="0"} 0.000176569
go_gc_duration_seconds{quantile="0.25"} 0.000176569
go_gc_duration_seconds{quantile="0.5"} 0.000220407
go_gc_duration_seconds{quantile="0.75"} 0.000220407
go_gc_duration_seconds{quantile="1"} 0.000220407
go_gc_duration_seconds_sum 0.000396976
go_gc_duration_seconds_count 2
现在你只需要告诉 Prometheus 数据在那里。 Prometheus 使用一组称为 scrape_configs 的规则,这些规则在其配置文件 prometheus.yml 中定义,以决定检查哪些主机以获取指标以及检查频率。 scrape_configs 可以在 Prometheus 配置文件中静态设置,但这并没有使 Prometheus 非常灵活。 每次你添加新目标时,都必须更新配置文件,手动停止 Prometheus,然后重新启动它。 Prometheus 有一种更好的方法,称为 基于文件的服务发现。
在上面的 Containerfile 中,有一个 stanza 将动态的基于文件的服务发现配置添加到 Prometheus 配置文件
RUN echo -e "\n\
  - job_name: 'dynamic'\n\
    file_sd_configs:\n\
    - files:\n\
      - data/sd_config*.yaml\n\
      - data/sd_config*.json\n\
      refresh_interval: 30s\
" >> prometheus.ym
这告诉 Prometheus 在挂载到正在运行的容器中的 Data 目录中查找名为 sd_config*.yaml 或 sd_config*.json 的文件,并每 30 秒检查一次,看看是否有更多配置文件或者它们是否已更改。 使用具有该命名约定的文件,你可以告诉 Prometheus 开始查找其他目标,例如你之前启动的 Node Exporter。
在 Data 目录中创建一个名为 sd_config_01.json 的文件,其中包含以下内容,将 your_hosts_ip_address 替换为运行 Node Exporter 的主机的 IP 地址
[{"labels": {"job": "node"}, "targets": ["your_hosts_ip_address:9100"]}检查 Prometheus 中的 http://127.0.0.1:9090/targets;你应该会看到 Prometheus 正在监控自身(在容器内)以及你为主机添加的带有 Node Exporter 的目标。 单击此新目标的链接以查看 Prometheus 抓取的原始数据。 它看起来应该很熟悉
# NOTE: Truncated for brevity
# HELP go_gc_duration_seconds A summary of the pause duration of garbage collection cycles.
# TYPE go_gc_duration_seconds summary
go_gc_duration_seconds{quantile="0"} 3.6547e-05
go_gc_duration_seconds{quantile="0.25"} 0.000107517
go_gc_duration_seconds{quantile="0.5"} 0.00017582
go_gc_duration_seconds{quantile="0.75"} 0.000503352
go_gc_duration_seconds{quantile="1"} 0.008072206
go_gc_duration_seconds_sum 0.029700021
go_gc_duration_seconds_count 55
这与 Node Exporter 正在导出的数据相同
http://127.0.0.1:9090/graph?g0.expr=rate(node_network_receive_bytes_total%7B%7D%5B5m%5D)&g0.tab=0&g0.stacked=0&g0.range_input=15m有了这些信息,你可以创建自己的规则并检测自己的应用程序以提供 Prometheus 可以使用的指标。
PromQL 简介
PromQL 是 Prometheus 的查询语言,是一种聚合存储在 Prometheus 中的时间序列数据的强大方法。 Prometheus 将查询的输出显示为原始结果,或者可以显示为显示数据随时间推移趋势的图表,如上面的 node_network_receive_bytes_total 示例。 PromQL 可能难以入门,本文不会深入探讨如何使用它的完整教程,但我将介绍一些基础知识。
首先,调出 Prometheus 的查询界面
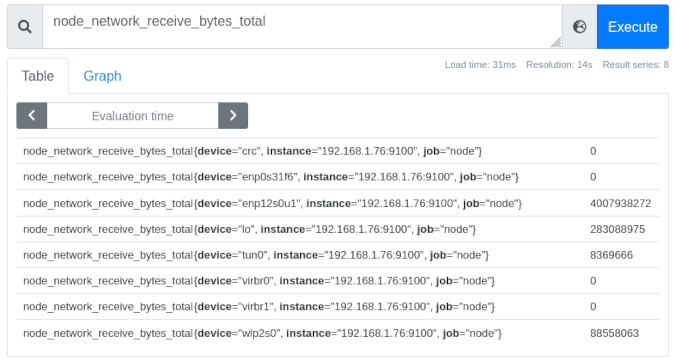
http://127.0.0.1:9090/graph在这个例子中,查看 node_network_receive_bytes_total 指标。将这个字符串输入到查询字段中,然后按 Enter 键,显示从 Node Exporter 运行的计算机上收集的所有网络指标。(请注意,Prometheus 提供了自动完成功能,可以轻松浏览它收集的指标。)您可能会看到多个结果,每个结果都带有已应用于 Node Exporter 发送的数据的标签。
(Chris Collins, CC BY-SA 4.0)
查看上图,您可以看到八个接口,每个接口都用设备名称(例如,{device="ensp12s0u1"})、收集它们的实例(在本例中,所有节点都是相同的)以及在 sd_config_01.json 中分配的作业节点进行标记。 在这些标签的右侧是该设备的最新原始指标数据。 在 ensp12s0u1 设备的情况下,自 Prometheus 开始跟踪数据以来,它已通过该接口接收了 4007938272 字节的数据。
注意:“job”标签对于定义正在收集的数据类型很有用。 例如,“node”表示 Node Exporter 发送的指标,“cluster”表示 Kubernetes 集群数据,或者某个特定应用程序的名称,用于监控您可能正在监控的特定服务。
单击 Graph 选项卡,您可以看到这些设备的指标随时间变化的图形(默认情况下为一小时)。 可以使用左侧的 - + 切换按钮调整时间段。 历史数据与当前值一起显示和绘制。 这提供了对数据随时间如何变化的宝贵见解。

(Chris Collins, CC BY-SA 4.0)
您可以使用标签进一步优化显示的数据。 此图显示了 Node Exporter 报告的所有接口,但是如果您只对无线设备感兴趣怎么办? 通过更改查询以包含标签 node_network_receive_bytes_total{device="wlp2s0"},您可以仅评估与该标签匹配的数据。 删除其他设备的数据后,Prometheus 会自动将比例调整为更易于理解的比例。

(Chris Collins, CC BY-SA 4.0)
这些数据本身很有用,但是 Prometheus 的 PromQL 还有几个可以应用于数据的查询函数,以提供更多信息。 例如,再次查看 rate() 函数。 rate() 函数“计算范围向量中时间序列的每秒平均增长率。” 这是一个花哨的说法,意思是“显示数据增长的速度有多快”。
查看上面无线设备的图表,您可以看到一条轻微的曲线——大约在 19:00 左右,折线图略有垂直增加。 它本身看起来并不多,但是使用 rate() 函数,可以计算出该时间段内增长峰值有多大。 使用查询 rate(node_network_receive_bytes_total{device="wlp2s0"}[15m]) 显示无线设备接收的字节的速率,每秒平均超过 15 分钟的时间段。

(Chris Collins, CC BY-SA 4.0)
显而易见的是,在 19:00 左右,无线设备在短时间内接收到的流量几乎是原来的三倍。
PromQL 可以做的远不止这些。 使用 predict_linear() 函数,Prometheus 可以对何时将超过某个阈值做出有根据的猜测。 使用相同的无线 network_receive_bytes 数据,您可以根据过去四个小时的数据(或您可能感兴趣的任何组合)预测未来四个小时的值。 尝试查询 predict_linear(node_network_receive_bytes_total{device="wlp2s0"}[4h], 4 * 3600)。
上面 predict_linear() 函数的重要部分是 [4h], 4 * 3600。 [4h] 告诉 Prometheus 使用过去四个小时的数据集,然后预测未来四个小时(或 4 * 3600,因为一小时有 3,600 秒)的值。 使用上面的示例,Prometheus 预测无线设备将在大约一个小时后接收到近 95MB 的数据(您的数据会有所不同)。

(Chris Collins, CC BY-SA 4.0)
您会开始了解这可能有多有用,尤其是在运营方面。 Kubernetes 导出节点磁盘使用情况指标,并包含一个内置警报,该警报使用 predict_linear() 来估计磁盘何时可能耗尽空间。 您可以将所有这些查询与 Prometheus 的 Alertmanager 结合使用,以在满足各种条件时通知您,从网络利用率过高到磁盘空间可能在未来四个小时内耗尽等等。 Alertmanager 是另一个有用的主题,我将在以后的文章中介绍。
结论
Prometheus 通过抓取端点以获取特殊格式的数据来消耗指标。 跟踪数据并可以查询时间点信息或绘制图表以显示随时间的变化。 更好的是,Prometheus 开箱即用地支持警报规则,这些规则可以通过多种方式连接到您的基础架构。 Prometheus 还可以用作其他项目(如 Grafana)的数据源,以提供更复杂的图形信息。
在现实世界的工作中,我们使用 Prometheus 跟踪指标并提供警报阈值,以便在集群不健康时通知我们,并使用 Grafana 来制作我们需要定期查看的数据仪表板。 我们导出节点数据以跟踪我们的节点,并检测我们的 operators 以跟踪其性能和运行状况。 Prometheus 是所有这些的支柱。
如果您对 Prometheus 感兴趣,请密切关注后续文章。 您将了解在满足某些条件时发出警报,使用 Prometheus 的内置 Alertmanager 及其集成,更复杂的 PromQL,以及如何检测您自己的应用程序并将其与 Prometheus 集成。


5 条评论