

在本教程中,我将解释如何使用 Pandas 和 Python 来处理杂乱的数据。如果您以前从未使用过 Pandas,并且了解 Python 的基础知识,那么本教程非常适合您。
天气数据是杂乱数据集的一个很好的真实示例。它带有混合内容、不规则的缺失值和时区,所有这些都是数据科学家常见的痛点。我将通过示例说明如何处理混合内容和不规则的缺失值。要处理奇怪的时区,请参阅 Mario Corchero 的优秀文章,如何使用 Python 处理日期和时间。
让我们从头开始,将一个杂乱的文件转换为有用的数据集。完整源代码可在 GitHub 上获取。
读取 CSV 文件
您可以使用以下代码在 Pandas 中打开 CSV 文件
- pandas.read_csv():将 CSV 文件作为 DataFrame(类似于表格)打开。
- DataFrame.head():显示前 5 个条目。
DataFrame 就像 Pandas 中的表格;它具有一组固定的列和索引。CSV 文件非常适合 DataFrame,因为它们以数据列和行的形式出现。
import pandas as pd

# Open a comma-separated values (CSV) file as a DataFrame
weather_observations = \
  pd.read_csv('observations/Canberra_observations.csv')

# Print the first 5 entries
weather_observations.head()

opensource.com
看起来我们的数据实际上是由 \t 制表符分隔的。其中有一些有趣的项,看起来像是时间。
pandas.read_csv() 为不同的情况提供了通用的关键字参数。在这里,您有一列用于日期,另一列用于时间。您可以引入一些关键字参数来增加一些智能性
- sep:列之间的分隔符
- parse_dates:将一列或多列视为日期
- dayfirst:使用 DD.MM.YYYY 格式,而不是月份优先
- infer_datetime_format:告诉 Pandas 猜测日期格式
- na_values:添加要视为空的值
使用这些关键字参数预先格式化数据,让 Pandas 完成一些繁重的工作。
# Supply pandas with some hints about the file to read
weather_observations = \
  pd.read_csv('observations/Canberra_observations.csv',
     sep='\t',
     parse_dates={'Datetime': ['Date', 'Time']},
     dayfirst=True,
     infer_datetime_format=True,
     na_values=['-']
)

Pandas 巧妙地将 Date 和 Time 两列转换为单个列 Datetime,并以标准格式呈现。
这里有一个 NaN 值,不要与“非数字”浮点数混淆。这只是 Pandas 表示它是空的方式。
按顺序排序数据
让我们看看 Pandas 可以处理数据顺序的方法。
- DataFrame.sort_values():按顺序重新排列。
- DataFrame.drop_duplicates():删除重复项。
- DataFrame.set_index():指定要用作索引的列。
因为时间似乎在倒退,所以让我们对其进行排序
# Sorting is ascending by default, or chronological order
sorted_dataframe = weather_observations.sort_values('Datetime')
sorted_dataframe.head()

为什么会有两个午夜?事实证明,我们的数据集(原始数据)包含每天结束和开始时的午夜。您可以丢弃一个作为重复项,因为第二天也会有另一个午夜。
这里的逻辑顺序是丢弃重复项,对数据进行排序,然后设置索引
# Sorting is ascending by default, or chronological order
sorted_dataframe = weather_observations.sort_values('Datetime')

# Remove duplicated items with the same date and time
no_duplicates = sorted_dataframe.drop_duplicates('Datetime', keep='last')

# Use `Datetime` as our DataFrame index
indexed_weather_observations = \
  sorted_dataframe.set_index('Datetime')
indexed_weather_observations.head()

opensource.com
现在您有了一个以时间为索引的 DataFrame,这在以后会很有用。首先,让我们转换风向。
转换列值
为了准备用于天气建模的风数据,您可以使用数值格式的风值。按照惯例,北风 (↓) 为 0 度,顺时针方向 ⟳。东风 (←) 为 90 度,依此类推。您将利用 Pandas 进行转换
- Series.apply():使用函数转换每个条目。
为了计算出每个风向的确切值,我手动编写了一个字典,因为只有 16 个值。这既简洁又易于理解。
# Translate wind direction to degrees
wind_directions = {
     'N':   0. , 'NNE':  22.5, 'NE':  45. , 'ENE':  67.5 ,
     'E':  90. , 'ESE': 112.5, 'SE': 135. , 'SSE': 157.5 ,
     'S': 180. , 'SSW': 202.5, 'SW': 225. , 'WSW': 247.5 ,
     'W': 270. , 'WNW': 292.5, 'NW': 315. , 'NNW': 337.5 }
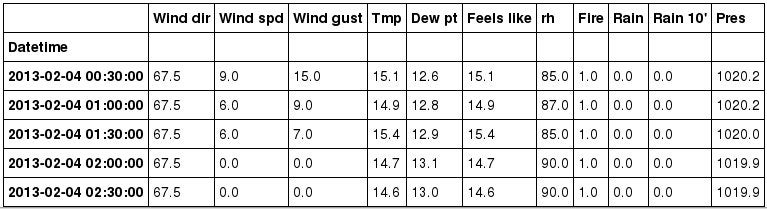
您可以像使用 Python 字典一样,通过索引访问器访问 DataFrame 列,在 Pandas 中称为 Series。转换后,Series 将被新值替换。
# Replace wind directions column with a new number column
# `get()` accesses values fomr the dictionary safely
indexed_weather_observations['Wind dir'] = \
    indexed_weather_observations['Wind dir'].apply(wind_directions.get)

# Display some entries
indexed_weather_observations.head()

opensource.com
每个有效的风向现在都是一个数字。值是字符串还是另一种数字都没有关系;您可以使用 Series.apply() 来转换它。
设置索引频率
深入挖掘,您会在数据集中发现更多缺陷
# One section where the data has weird timestamps ...
indexed_weather_observations[1800:1805]

opensource.com
00:33:00?01:11:00?这些是奇怪的时间戳。有一个函数可以确保一致的频率
DataFrame.asfreq():强制索引具有特定频率,丢弃并填充其余部分。
# Force the index to be every 30 minutes
regular_observations = \
  indexed_weather_observations.asfreq('30min')

# Same section at different indices since setting
# its frequency :)
regular_observations[1633:1638]

opensource.com
Pandas 丢弃任何与频率不匹配的索引,并在不存在索引时添加空行。现在您有了一致的索引频率。让我们用 matplotlib(一个流行的绘图库)绘制它,看看它是什么样子
import matplotlib.pyplot as plt

# Make the graphs a bit prettier
pd.set_option('display.mpl_style', 'default')
plt.rcParams['figure.figsize'] = (18, 5)

# Plot the first 500 entries with selected columns
regular_observations[['Wind spd', 'Wind gust', 'Tmp', 'Feels like']][:500].plot()

opensource.com
仔细观察,似乎在 1 月 6 日、7 日左右以及更多地方存在空白。您需要用有意义的内容填充这些空白。
插值和填充空行
为了填充空白,您可以线性插值这些值,或者从空白的两个端点绘制一条线,并相应地填充每个时间戳。
- Series.interpolate():根据索引填充空值。
在这里,您还使用 inplace 关键字参数来告诉 Pandas 执行操作并替换自身。
# Interpolate data to fill empty values
for column in regular_observations.columns:
    regular_observations[column].interpolate('time', inplace=True, limit_direction='both')

# Display some interpolated entries
regular_observations[1633:1638]
opensource.com
NaN 值已被替换。让我们再次绘制它
# Plot it again - gap free!
regular_observations[['Wind spd', 'Wind gust', 'Tmp', 'Feels like']][:500].plot()

opensource.com
恭喜!数据现在已准备好用于天气处理。您可以在 GitHub 上下载示例代码并进行尝试。
结论
我已经展示了如何通过多种方式使用 Python 和 Pandas 清理杂乱的数据,例如
- 使用正确的结构读取 CSV 文件,
- 对数据集进行排序,
- 通过应用函数转换列
- 规范数据频率
- 插值和填充缺失数据
- 绘制数据集
Pandas 提供了更多强大的功能,您可以在文档及其优秀的10 分钟入门中找到。您可能会在其中找到一些宝藏。如果您有任何问题或想法,请随时通过 Twitter 联系我 @Xavier_Ho。
祝您数据清理愉快!
更多资源
- SciPy Interpolate:不仅仅是线性插值来填充您的数据集。
- XArray 和 Pandas:处理大于系统内存的数据集?从这里开始。
- 使用 Python 可视化数据:Clare Sloggett 在 PyCon AU 2017 上的演讲视频。


3 条评论